Designing Blind: Does an AI Vision Model Actually Improve Design Output?
I built the same infographic with a text-only AI model and its vision sibling — same family, same spec, one variable: the vision encoder. The charts looked almost identical, but the vision model caught and fixed six real defects the blind model couldn't see. Vision doesn't make AI output prettier — it makes the model able to check its own work.
I built the same infographic with a text-only AI model and its vision sibling — same family, same provider, same spec, one variable: the vision encoder. The charts looked almost identical. But the vision model caught and fixed six real defects the text-only model couldn’t see. Vision doesn’t make AI output prettier — it makes the model able to check its own work.
DeepSeek shipped a vision-capable model, and for deepseek-v4-flash — my daily-driver workhorse — vision was the only real drawback. So I ran the experiment the launch invites: what does a vision model actually get you that a non-vision model doesn’t?
The experiment: what I changed
I built the same infographic twice with two models from the same family and provider: deepseek-v4-flash, text-only, and deepseek-v4-flash-vision-exp, native vision. Same spec, same data, same prompt family. One variable: the vision encoder.
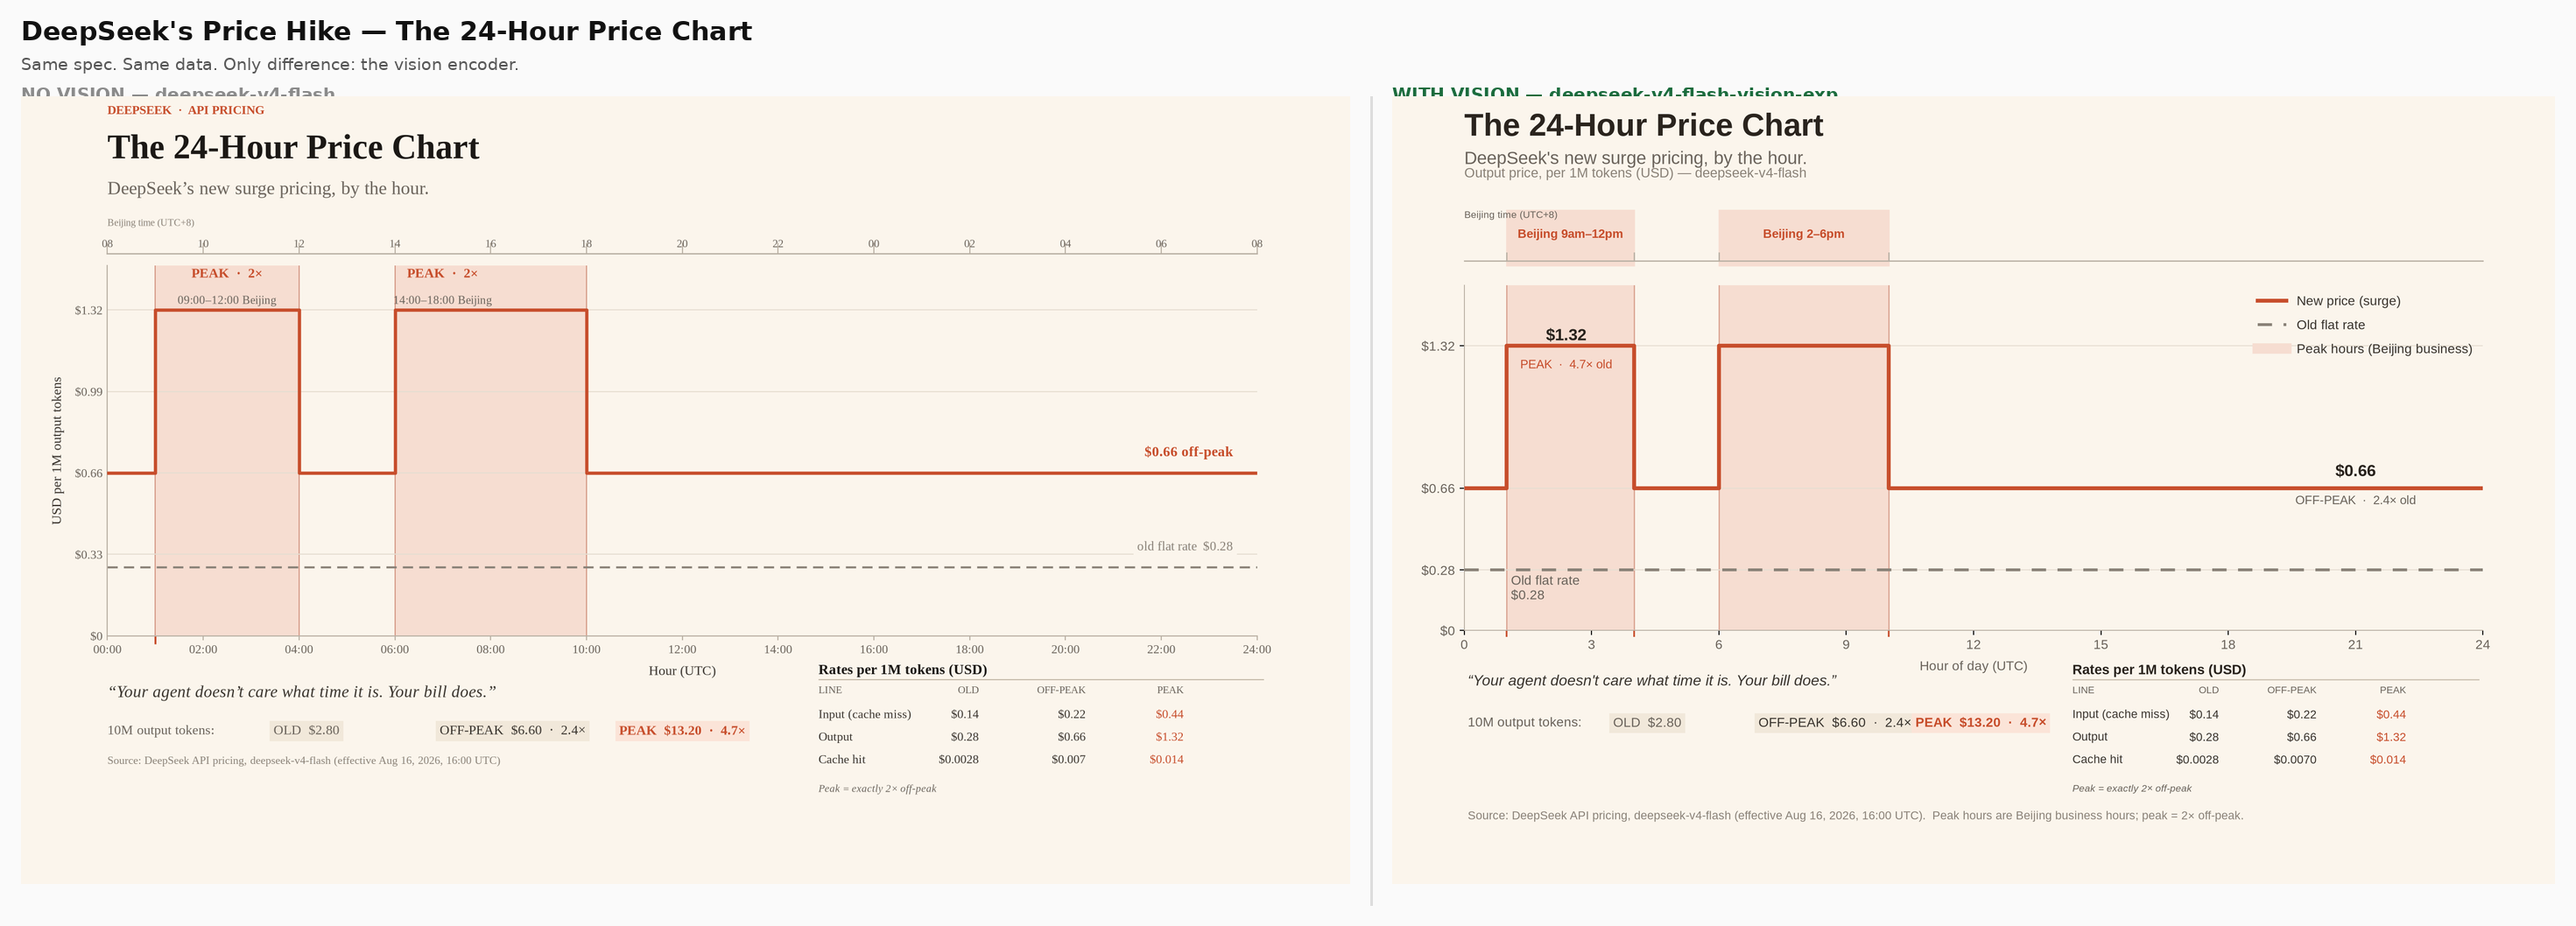
The result surprised me twice.
First, the two charts look almost the same. Vision didn’t change the strategy — palette, composition, the architecture of the graphic. If you assumed a vision model means dramatically better-looking output, that assumption can die here.
What vision changed was the finish: a legend that makes clear what’s being measured, transitions a reader can locate on the axis, corrections that let the message land without the viewer working for it. The blind chart was usable. The sighted chart communicates.
The second surprise took longer to see: the blind model played it safe because it knew it was blind.
The example: DeepSeek’s new surge pricing
The asset both models built is a chart of DeepSeek’s new surge pricing. DeepSeek killed its flat rate on August 16, 2026 at 16:00 UTC. Per 1M tokens, USD:
| Old (flat) | New off-peak | New peak | |
|---|---|---|---|
| Output | $0.28 | $0.66 | $1.32 |
| Input (cache miss) | $0.14 | $0.22 | $0.44 |
| Cache hit | $0.0028 | $0.007 | $0.014 |
Peak hours are 01:00–04:00 and 06:00–10:00 UTC — 9am to noon and 2 to 6pm in Beijing, seven hours out of every twenty-four. Peak is exactly double off-peak: output runs 2.4× the old price off-peak and 4.7× at peak. Ten million output tokens cost $2.80 under the old rate, $6.60 off-peak, $13.20 at peak.
If you run agents, the questions are concrete: how big is the hike, and when should work be scheduled to dodge the peak? A rate table doesn’t answer that at a glance. A 24-hour chart does — flat dashed line for the old price, sawtooth for the new one, spikes on Beijing business hours. Your agent doesn’t care what time it is. Your bill does.
I write about AI tools with receipts; get the next post by email.
Getting to a fair fight
My first attempts weren’t apples-to-apples — both models had freedom in both directions, and the gap looked much bigger than it was. I couldn’t tell how much was vision and how much was two models choosing differently.
So I clamped everything down: one spec, one data table, one prompt family, same provider. Each model built the chart, critiqued its own work, and revised. The only difference left standing was whether the model could look at what it had built.
What vision doesn’t change
Zoom out on the hero image. Same layout skeleton, same sawtooth, same story. The vision model didn’t invent a better chart — it drew the chart the spec asked for. What vision moves is the last mile, and the last mile is where charts succeed or fail: which label explains what’s being measured, whether a reader can find the hour the price changes, whether anything collides. Strategy was never the bottleneck. Finish is.
The blind panel: usable, honest, safe
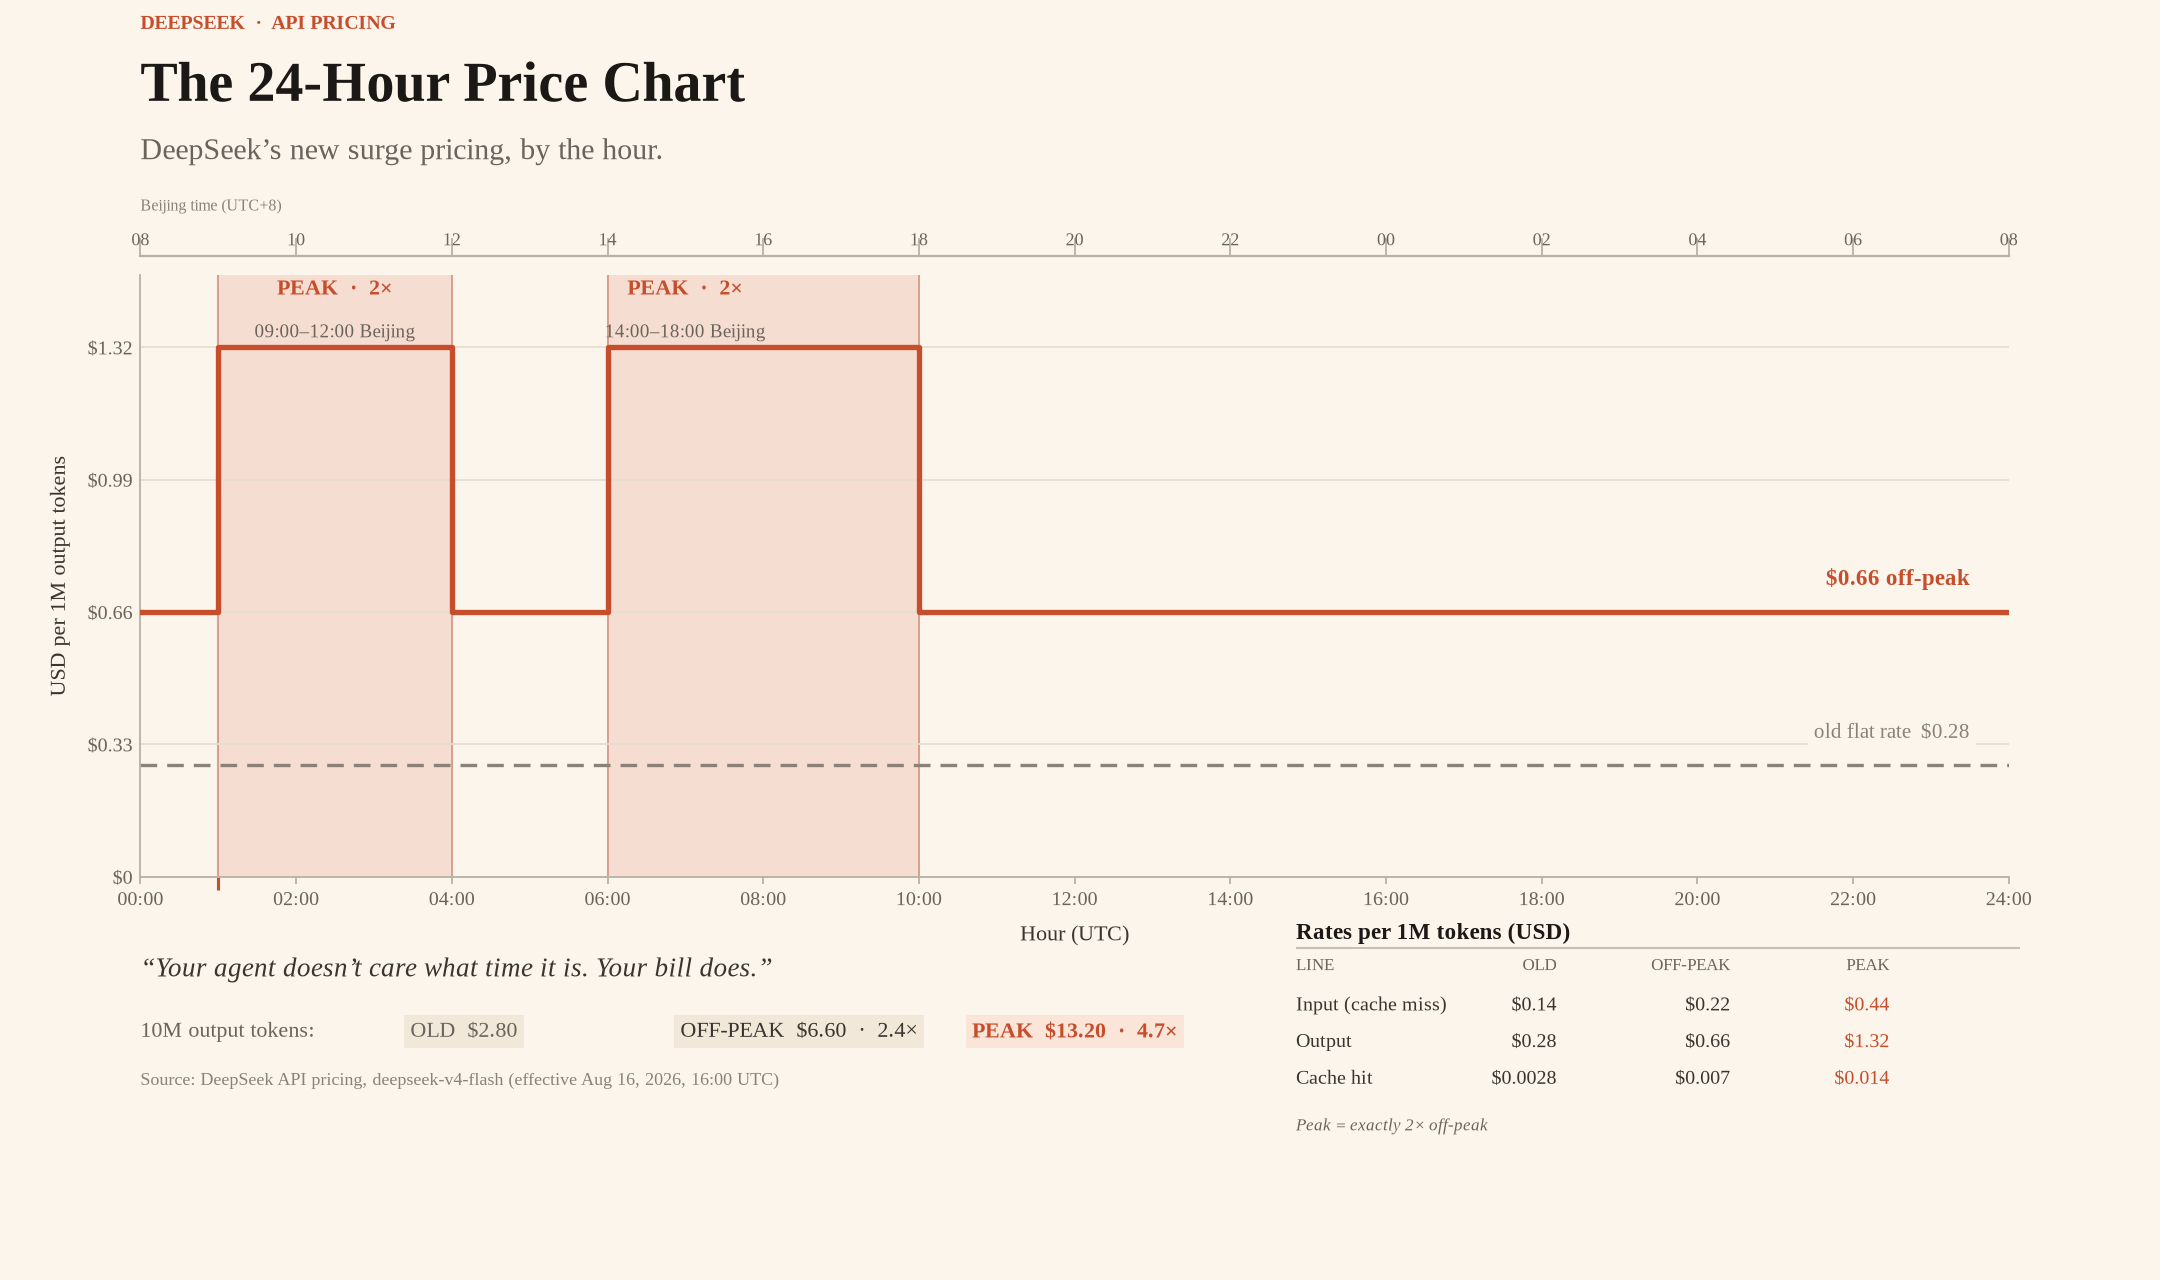
The text-only model shipped a working chart and was bluntly honest about its ceiling: every claim in its self-critique tagged as either reasoned from code or not verifiable without vision. And when it came time to fix the things that needed eyes, the refusal, verbatim:
I cannot verify without vision. That would be guessing, not fixing.
It fixed what arithmetic could prove — an integrated audit of 67 text elements with zero overlaps — and declined everything else. A weaker discipline would have faked the perceptual layer.
What vision changes: the finish
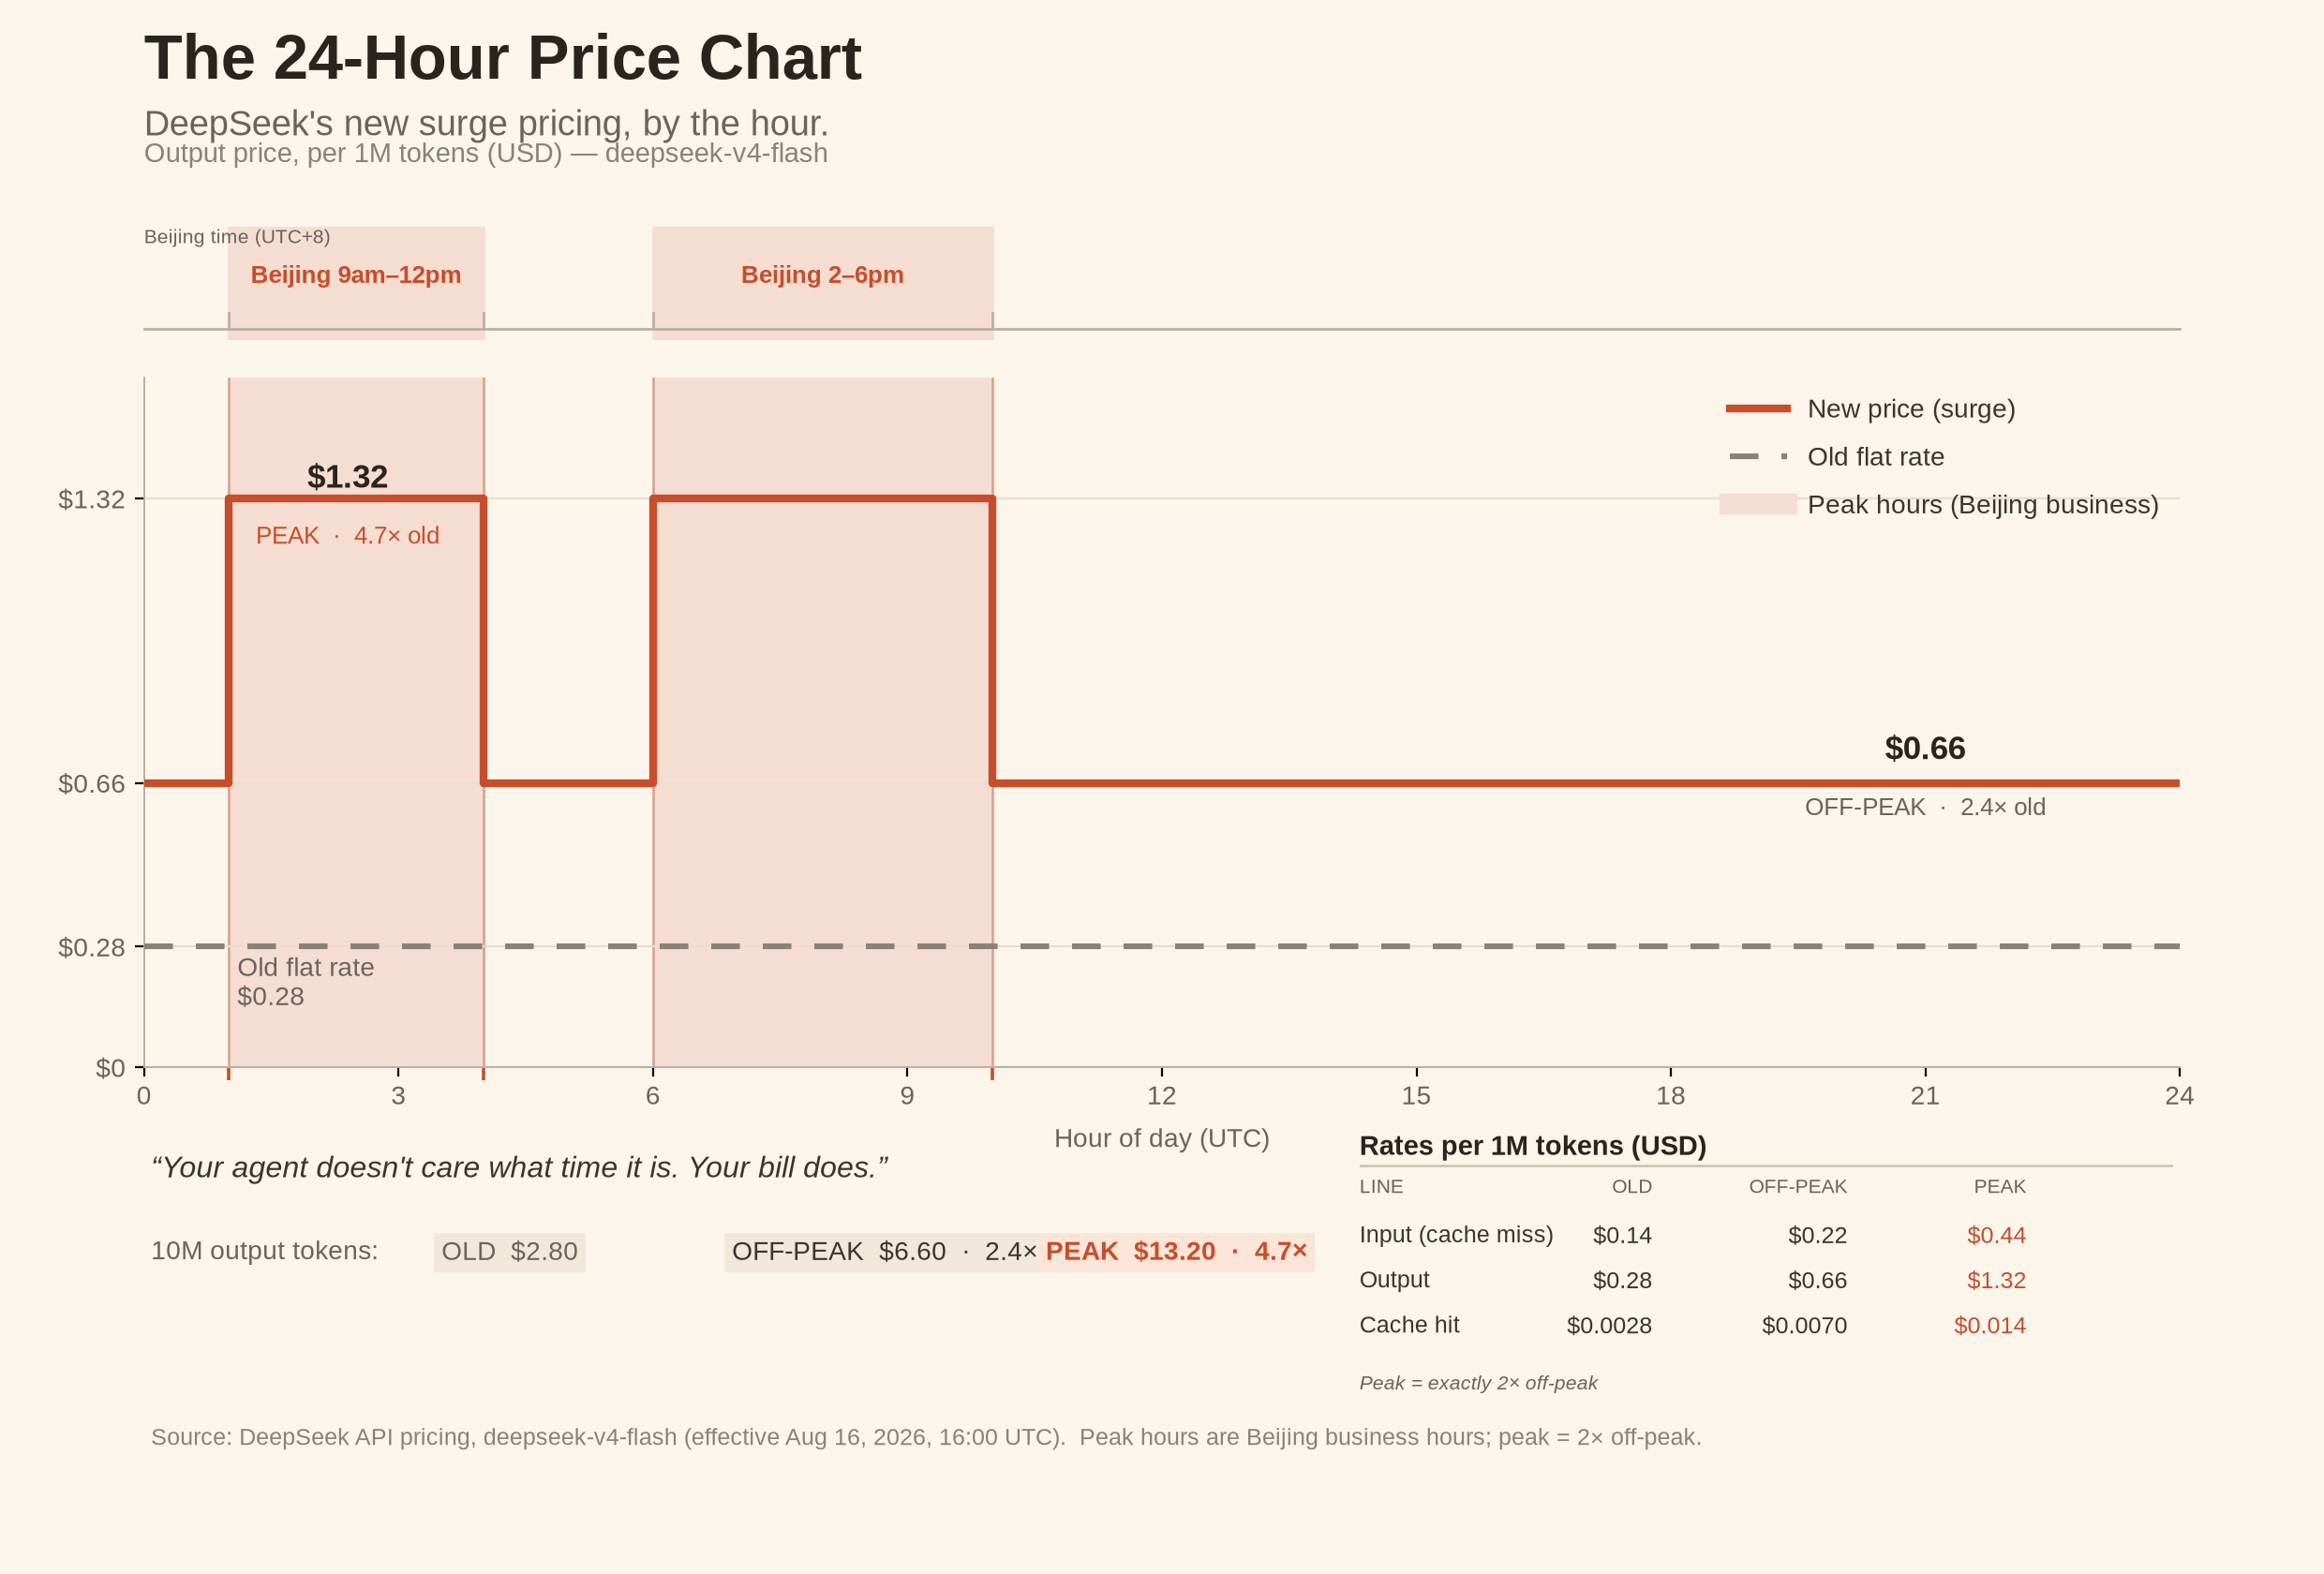
The vision model ran the same loop with eyes open, after proving them real with a fidelity probe: exact transcription of a unique token before any critique. It found six real defects and fixed all of them. Each fix was pixel-verified before it counted.
The receipts: six pixel-verified fixes
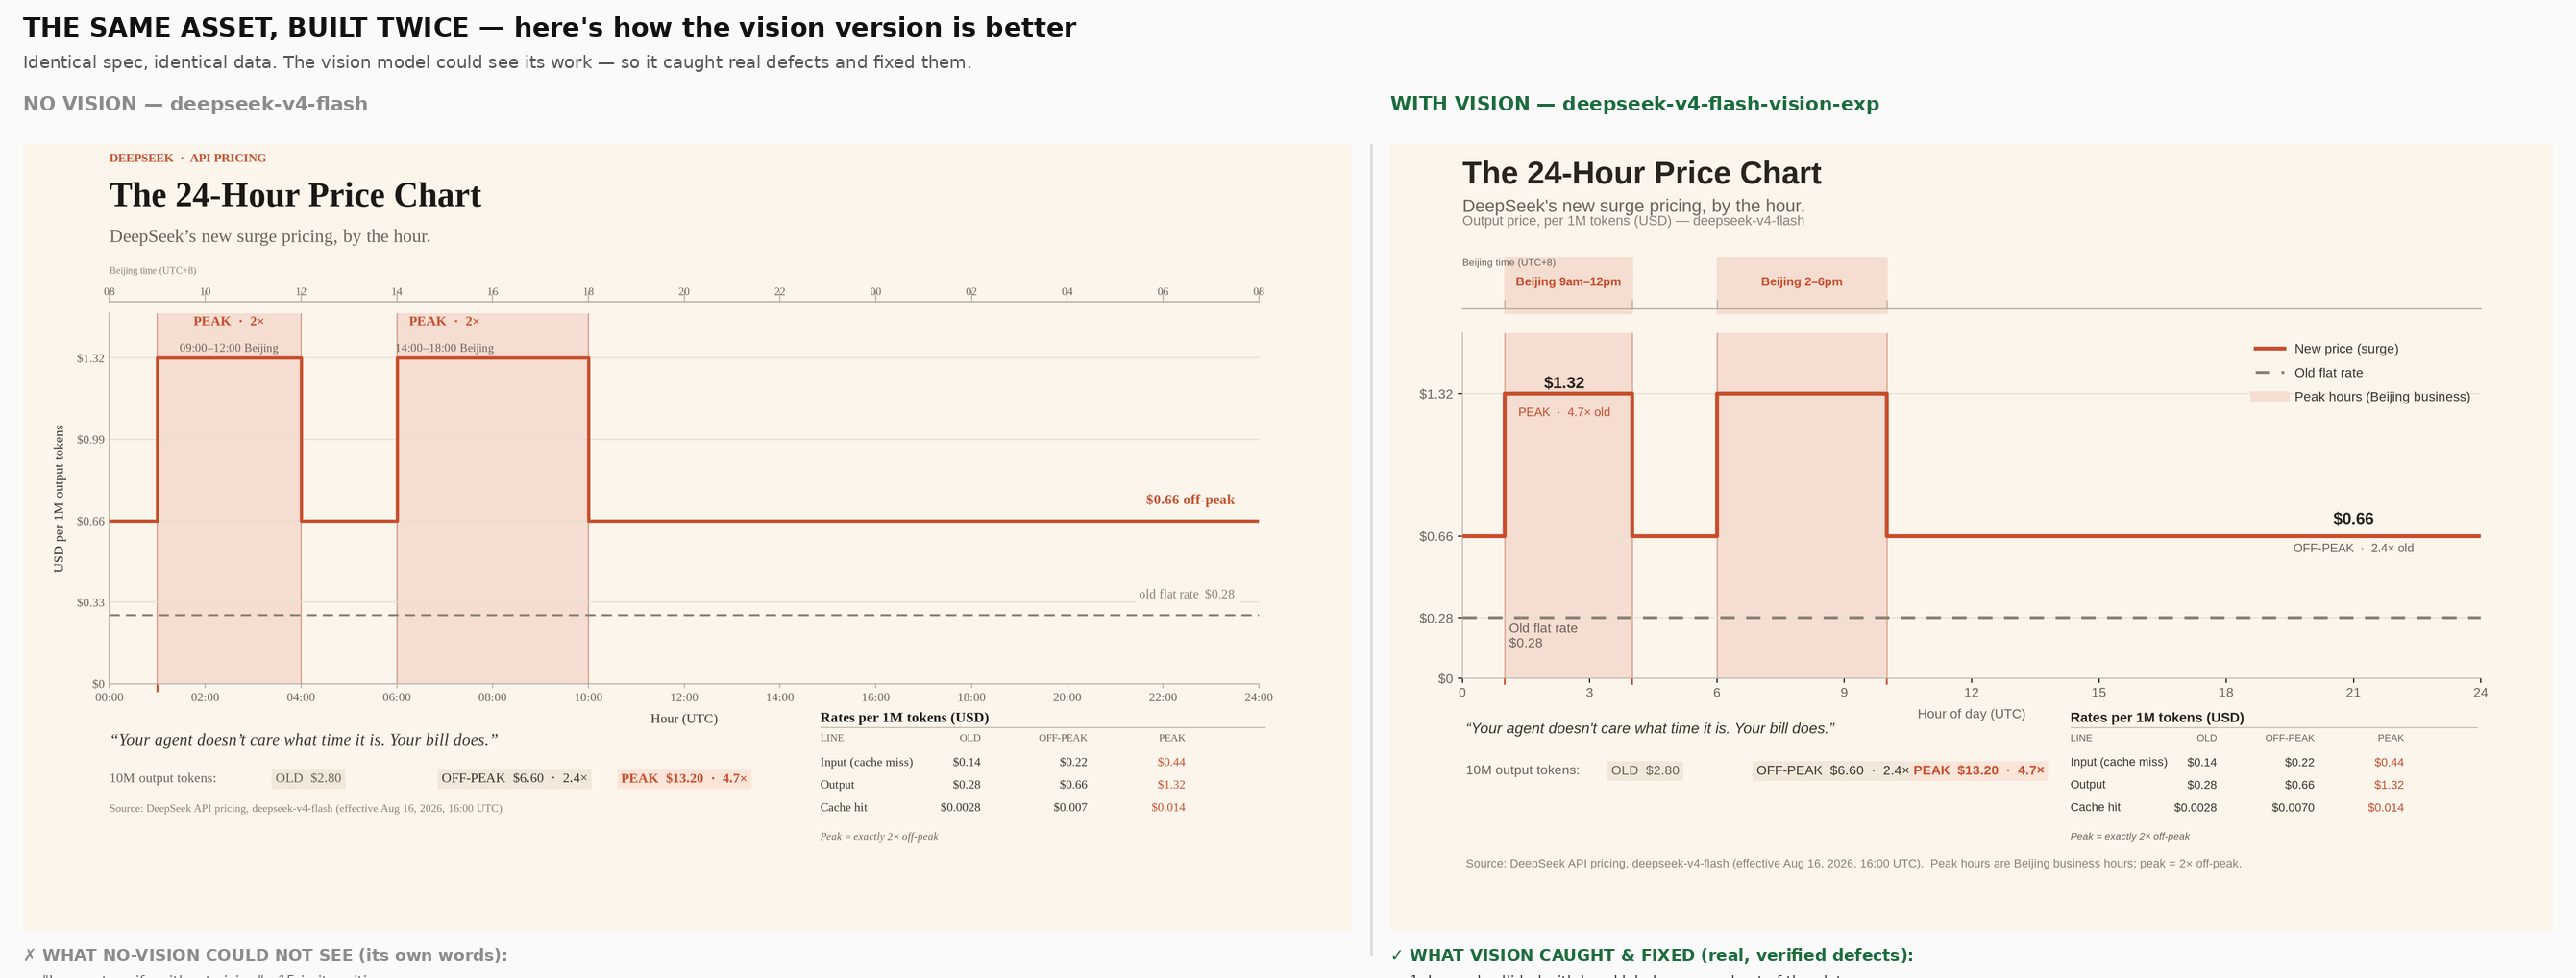
The six defects the vision model caught and fixed:
- A legend colliding with the band labels
- A label clipped at the image edge
- Step transitions a reader couldn’t locate
- Guide lines burying the step line
- A rate-card header overlapping the x-axis ticks
- A source line running under the table
Every fix is small, and every one removes work the viewer was doing to decode the chart. Vision didn’t buy a better chart. It bought a chart that stops leaking attention.
One caveat from the panel’s own log: its eyes are coarse — small text gets confabulated — so it rejects its own false sightings with pixel checks. Vision raises the hypothesis; pixels confirm it.
And the data? A deterministic verifier scored both panels 11 out of 11. Data was never the differentiator. Finish was.
Designing blind
A text-only model designing a visual asset is designing blind. It can get the data perfect and audit geometry from first principles — in this test it did both. What it can’t do is close the loop between what it meant and what actually rendered, so it won’t take the risks that need the loop, and the last mile stays unfixed.
Practically:
- Generating visual assets with a text-only model? Expect correct data and a safe layout; budget a human or vision pass for the finish.
- Have a vision model in the loop? Make it look at its own render, probe its fidelity first, and cross-check its claims.
- Comparing models? Hold everything equal except the variable you’re testing.
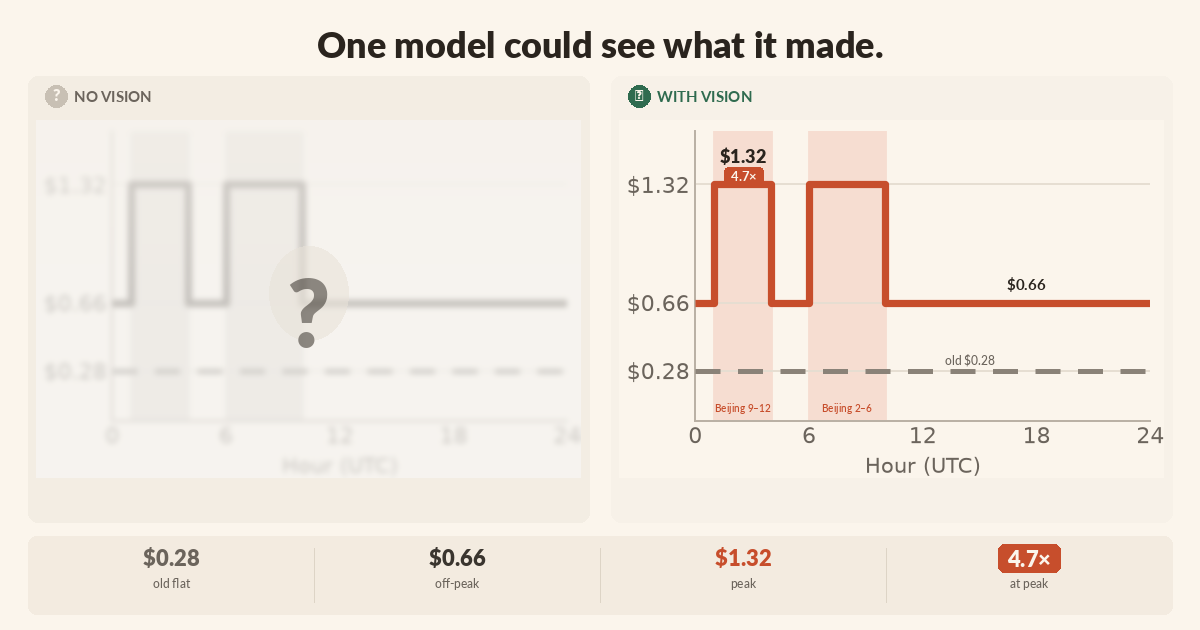
Vision doesn’t make the chart prettier. It makes the model able to check its own work. Without it, you’re not just designing blind — you’re shipping blind, and your model knows it.