How can you measure the impact of AI on your dev team’s velocity?
A practicing engineering manager's field answer to how you measure AI's impact on a dev team: METR's 39-point perception gap, why velocity flatlines, and what to report instead of a productivity percentage.
Two questions. One answer. As of early 2026.
The short answer: senior executives are asking what AI does to a dev team’s velocity, and whether there’s a number that proves it. There isn’t. The most rigorous study of AI and developer productivity — METR’s randomized trial — found experienced developers took 19% longer with early-2025 AI tools while still believing they were 20% faster: a 39-point gap between perception and measurement. Velocity flatlines because the metric absorbs the gain. What I report instead is the narrower, more useful evidence: what work AI made possible, what it removed, and where the queue moved.
The two questions
Senior executives are asking two things about AI and their development teams:
- What should we expect to happen to our dev team’s velocity when it properly utilizes AI?
- What is the actual impact of AI on our dev team?
The first question has an answer that surprises people. The second has an answer that matters. Here are both, with the bounds I would put around them.
On velocity: expect roughly flat, if the team already accounts for AI when it estimates work. A task that became easier also became a smaller estimate, so the gain is real but the metric absorbed it. A team that has not yet folded AI into its estimates may see velocity rise for a while first. That is an explanation of how the metric behaves, not a measured universal result.
On impact: large, and mostly invisible in the velocity chart. Teams attempt work they used to defer. Whole categories of work leave the development queue. Responsibilities shift, because agents change who can do what. None of that collapses into one trustworthy, general aggregate productivity number.
That is what I mean when I say the metric does not exist. Measurement is not impossible; narrow task measurements and local operational evidence are real and useful. What the evidence cannot support is a clean percentage for AI’s impact on a development team in general: the number an executive could put on a slide and defend to a board.
The rest of this post is the evidence for that claim, and what I report instead.
What happened when METR tried to measure it
The most rigorous attempt to measure the impact directly came from METR, a nonprofit research lab. In early 2025 it ran a randomized study: 16 experienced open-source developers, 246 real issues from their own repositories, each task randomly assigned to allow or forbid AI, with twenty potential confounders checked. It is the closest thing to a controlled trial this question has.
With the early-2025 tools in the study, developers took 19% longer when they used AI. Before the study, they predicted AI would make them 24% faster. Afterward, having been measurably slower, they still believed it had made them 20% faster. That 39-point gap between perception and measured completion time is the detail I would underline for executives, because it means self-report cannot substitute for measurement here. The people best positioned to judge their own speed were wrong, in the direction that flattered the tool.
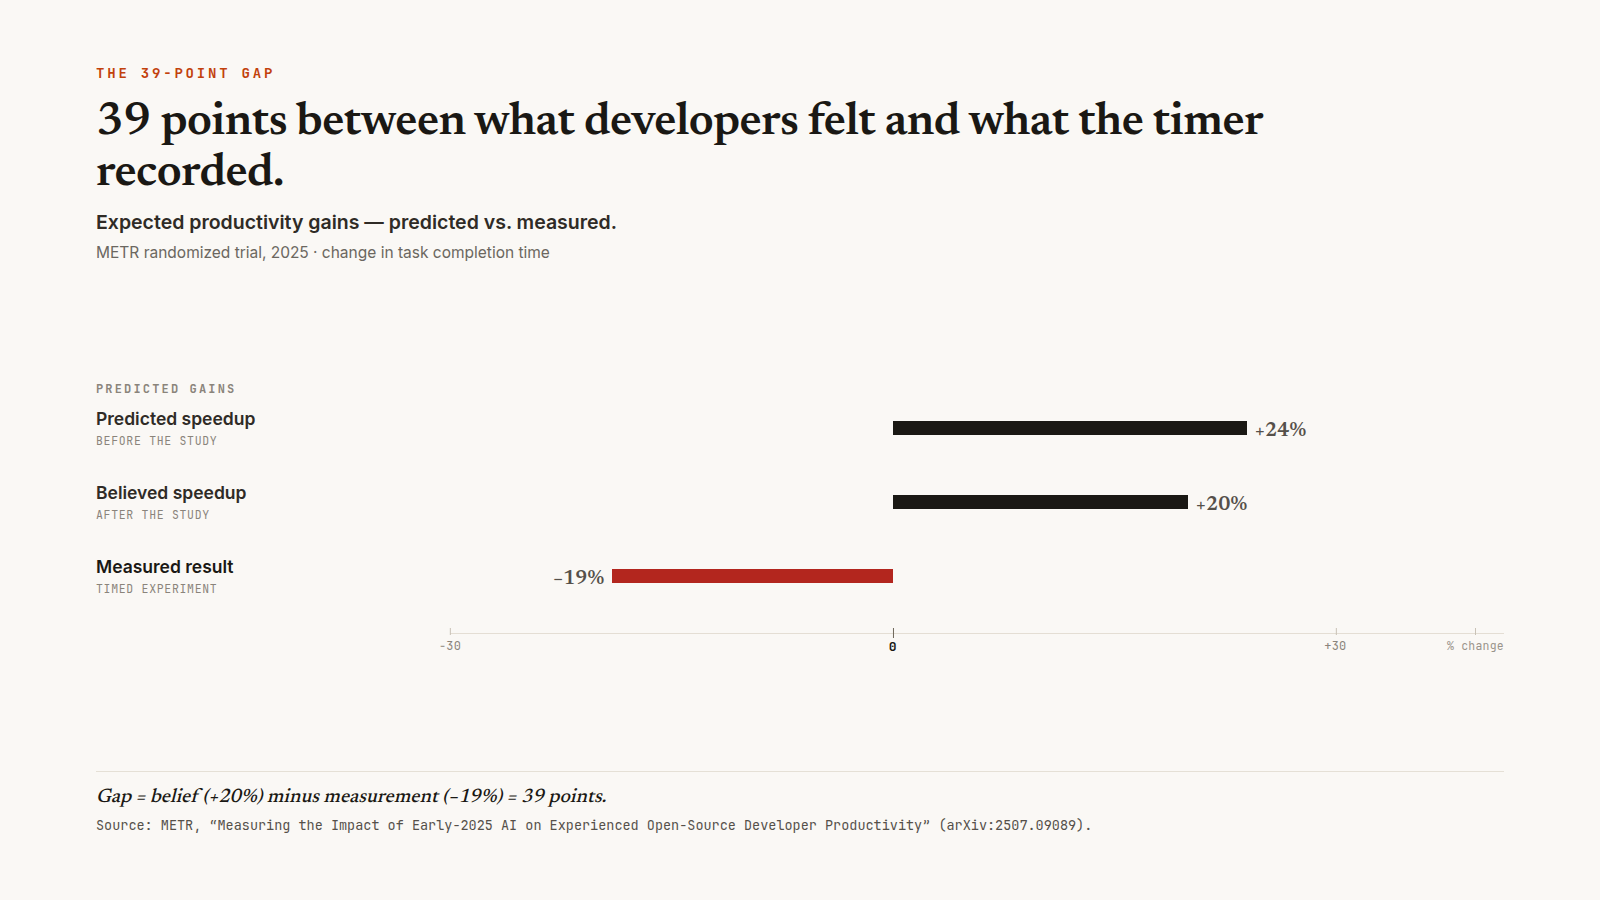 39 points between what developers felt and what the timer recorded. — METR (2025), arXiv:2507.09089
METR then tried to repeat the experiment with newer tools, 57 developers with a median of ten years of experience, and more than 800 tasks. The follow-up broke in an instructive way. The randomized design no longer represented normal AI-assisted work: some developers refused to participate without AI, between 30% and 50% of participants withheld tasks they expected would be painful without it, and others ran multiple agents at once and multitasked, which made elapsed time difficult to interpret.
METR concluded that its task-level randomized trial was “a bad proxy for the real productivity impact.” One participant explained the practical problem: “My head’s going to explode if I try to do too much the old fashioned way because it’s like trying to get across the city walking when all of a sudden I was more used to taking an Uber.”
By May 2026, METR had moved to a survey of 349 technical workers. The median respondent reported working three times faster. METR itself warned that “there are reasons to be skeptical of people’s responses to counterfactual questions,” citing its earlier finding that developers had overestimated AI’s effect by about 40 percentage points.
Taken together, the three results explain why there is still no trustworthy general number. The controlled trial used older tools and a narrow population. The attempt to update it could not hold a representative control group, because working without AI had become something experienced developers would no longer do. And the broadest current estimate is self-reported, which is exactly the kind of number the first study showed can be badly wrong. The more rigorous the method, the narrower the claim it can currently support.
I write about what actually works when running agents; you can get the next post by email.
Code production is not the same as shipped releases
The next place to look is the pipeline between writing code and shipping it. The studies below measure different populations and outcomes, so they cannot be combined into one productivity number, but they agree on the direction: code production can rise much faster than shipped releases.
A 2026 NBER/MIT study followed more than 100,000 GitHub developers across three generations of AI tools using a matched event-study design. It found roughly 180% more commits, far more than three times the lines changed, about 50% more projects worked on, and about 30% more shipped releases.
| Production stage | Gain |
|---|---|
| Commits | ~180% |
| Lines changed | “far more” than 3x |
| Projects worked on | ~50% more |
| Shipped releases | ~30% more |
For interactive coding agents alone, a more than sevenfold increase in lines changed became a 65% increase in pull requests, while releases rose 20%. The study measured changes in activity and output, not direct writing speed. The gain attenuated as it moved through review, testing, integration, and release.
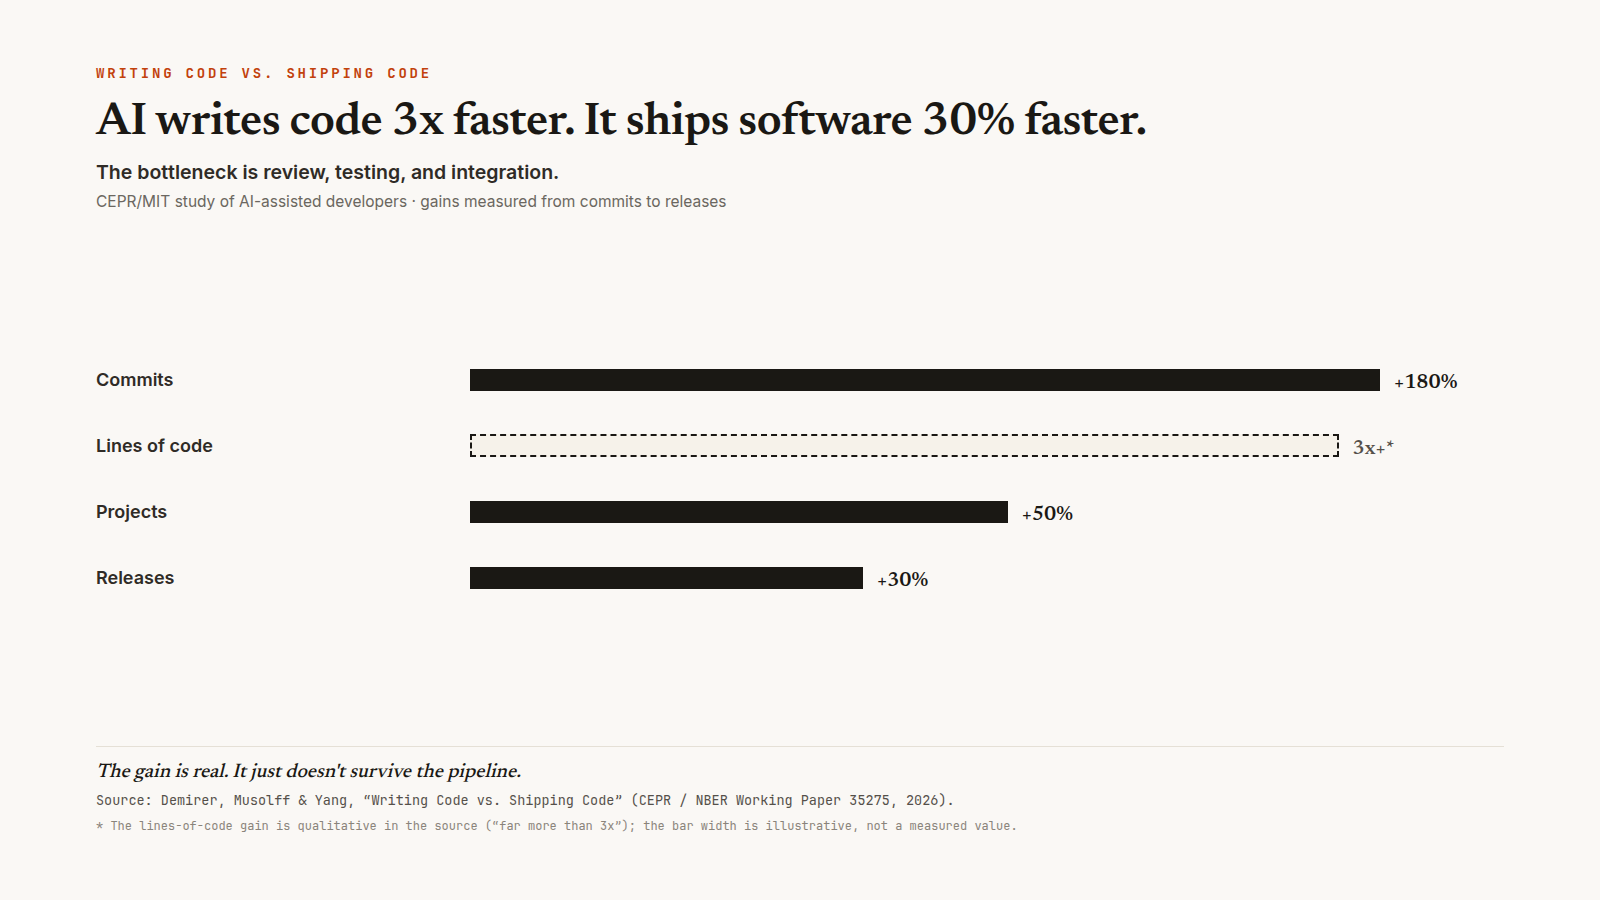 Code output rose much faster than shipped releases. The gain attenuated through review, testing, integration, and release. — NBER Working Paper 35275 (2026)
Google’s 2025 DORA survey of nearly 5,000 technology professionals measured a different part of the system. It found 90% AI adoption, more than 80% reporting personal productivity gains, and 59% reporting a positive effect on code quality. DORA described AI as an amplifier: organizational delivery results depended on the organization’s existing strengths and dysfunctions.
| DORA 2025 finding | Value |
|---|---|
| AI adoption rate | 90% |
| Report personal productivity gains | 80%+ |
| Report positive code quality impact | 59% |
| Review time increase | +91% |
| Bug rate increase | +9% |
| Teams admitting to manipulating velocity | 42% |
Self-reported productivity is meaningful as perception data. It is not the same measure as shipped releases or elapsed task time, and the METR results above are the reason to keep those categories separate.
Review and quality absorb part of the gain
If code production rises faster than releases, the difference has to go somewhere. The quality datasets suggest where.
GitClear analyzed 623 million code changes from 2023 through 2026 across eight quality signals. Compared with 2022, refactoring line moves fell 70% and long-term legacy maintenance fell 74%. From 2023, cross-file function calls fell 35% and code block duplication rose 81%. Within-commit copy and paste rose 41%, while error-masking constructs rose 47%. Code churn increased from 3.3% in 2021 to 7.1% in 2025.
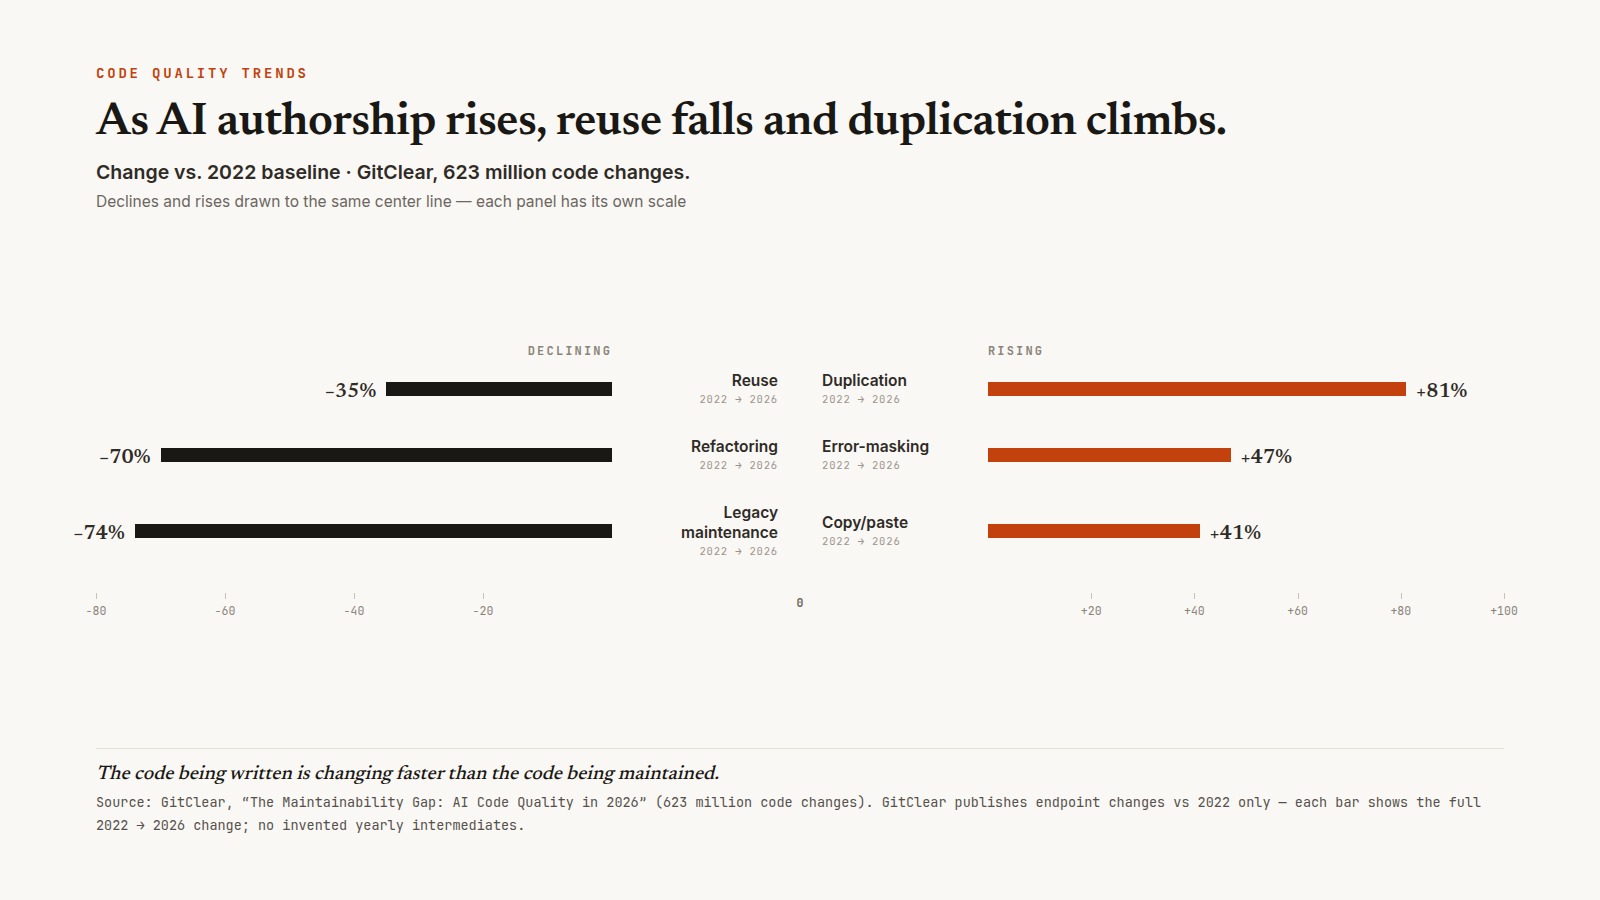 As AI authorship rises, reuse falls and duplication climbs. — GitClear, The Maintainability Gap (2026)
Faros AI examined telemetry from 22,000 developers across 4,000 teams in 2026. Under high AI adoption, it reported PR size up 51.3%, bugs per developer up 54%, median time in PR review up 441%, PRs merged without review up 31%, and production incidents per PR tripling. Its 2025 study had found 98% more PRs merged but no improvement in DORA metrics.
If your review queue got longer this year, you are in good company.
These are observational results, not proof that AI caused every change. But taken together with the NBER/MIT attenuation from code to releases, they suggest the same thing: producing more code can move work into review, integration, testing, and maintenance rather than removing it.
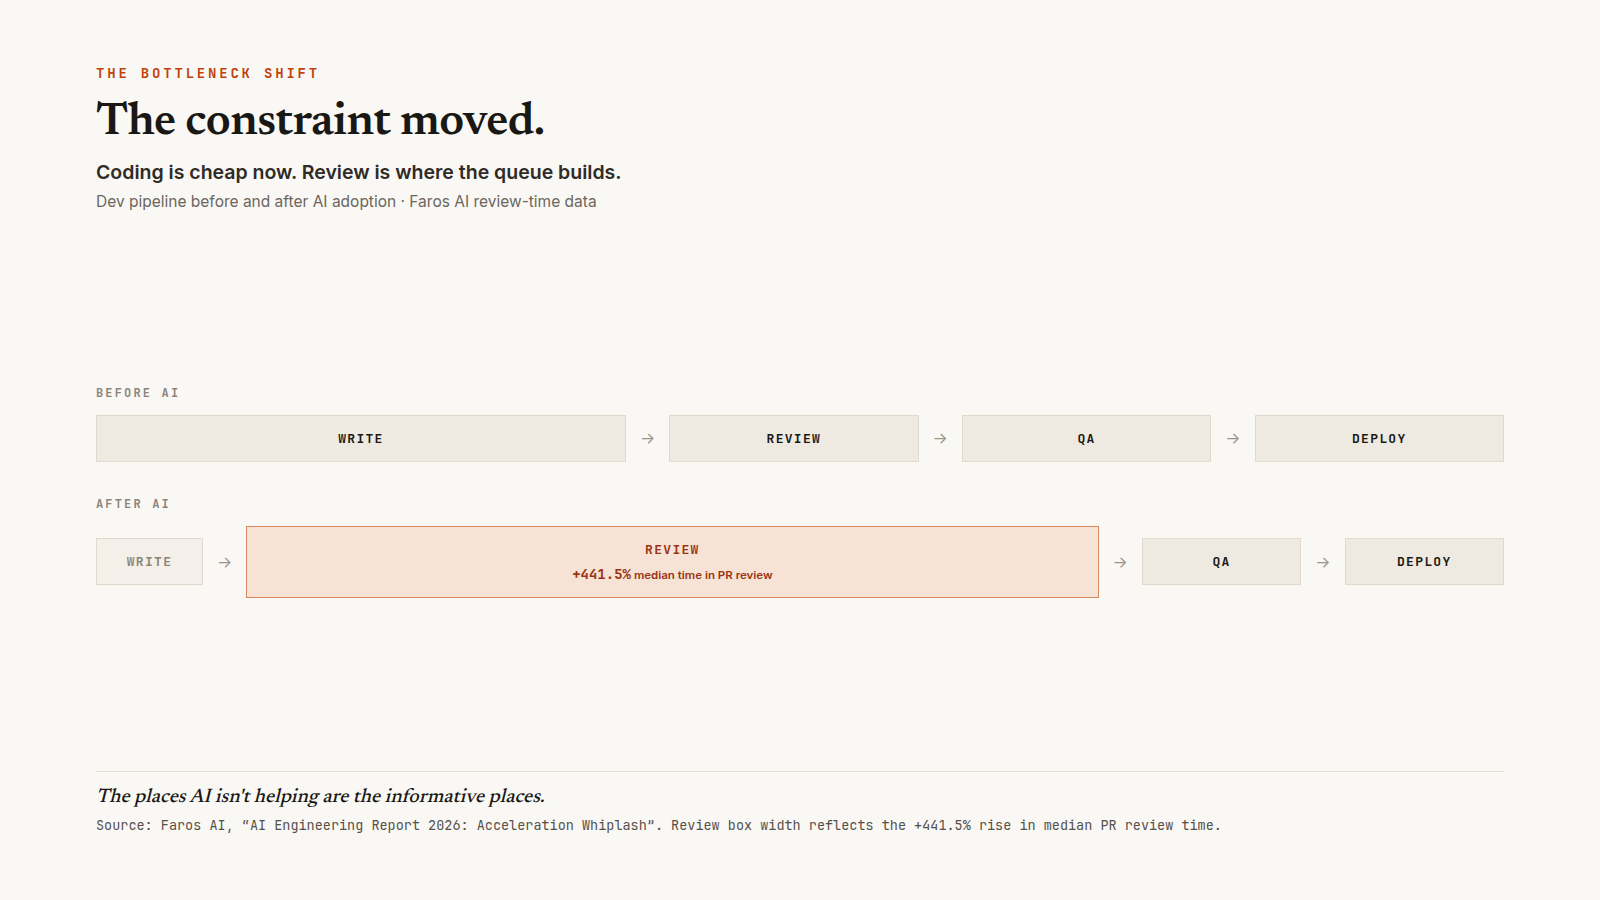 The constraint can move from code production into review, testing, and integration. — Faros AI, AI Engineering Report 2026
Organizations are making decisions before the number is settled
None of this measurement uncertainty has slowed the decisions down.
Gartner surveyed 350 executives at billion-dollar companies already deploying AI. Eighty percent reported cutting headcount after deployment, yet the companies that cut the most showed nearly identical financial returns to those that cut the least. Actual headcount reductions ranged from 0% to 3%. “Workforce reductions may create budget room, but they do not create return,” Gartner analyst Helen Poitevin said.
A 2025 Stanford Digital Economy Lab study analyzed millions of ADP payroll records. Employment for software developers aged 22 to 25 declined nearly 20% from its late-2022 peak, while employment for workers aged 35 to 49 in the same occupations grew 6% to 9%. After controlling for firm-level shocks, the researchers found a 16% relative employment decline for workers aged 22 to 25 in the most AI-exposed occupations.
The Stanford result is an association between AI exposure and employment patterns. It does not establish that AI caused the decline, and it does not produce a productivity number. What it does show is that hiring and staffing are already changing while the aggregate productivity evidence remains unsettled.
The operational evidence I would report
So the number is not settled, but leadership’s questions will not wait. I no longer promise one productivity percentage. What I report instead is the specific work AI made possible, the work it removed, and where the queue moved next. Each claim needs a concrete before and after within a defined scope. Here is what that looks like on my team.
Difficult support questions used to require a senior developer, the person who could trace a problem across four or five layers of microservices. Now all the developers work the support channel with agents connected to our diagnostic tools. They gain visibility into the wider system, and senior developers no longer have to handle every investigation themselves. That is a capability change on my team, not a general speedup percentage, and it is the kind of claim I can show with before-and-after evidence rather than argue about.
Data exports used to work the same way. Operations wanted a CSV, the request became a one-off Python script, and a developer spent a day or two on it. Now operations can query the data through MCP servers without opening a development story. The work did not get faster. It left the development queue.
There is also work we now attempt that we used to defer. I will not turn that into an abstract score, because the honest version is naming the actual work. The useful question in a leadership review is what changed in how the team operates, what became possible and what stopped consuming developer time, not how many points appeared on a dashboard.
Electricity is a useful warning about old measures
None of this measurement trouble means AI is not working. It may mean we are early. General-purpose technologies have broken their metrics before.
James Watt translated steam power into horsepower because buyers understood horses. The unit made a new technology legible in old terms, even though a real horse’s sustained and peak output varied widely. The measurement was a concession to the audience, not a property of the machine.
Electricity is the more instructive parallel. Paul David’s 1990 paper documented roughly 40 years between the dynamo in 1881 and measurable productivity gains in the 1920s. Factories first used electric motors as drop-in replacements for steam engines, keeping the same central shafts, belts, layouts, and processes. Larger gains appeared after factories redesigned around distributed motors.
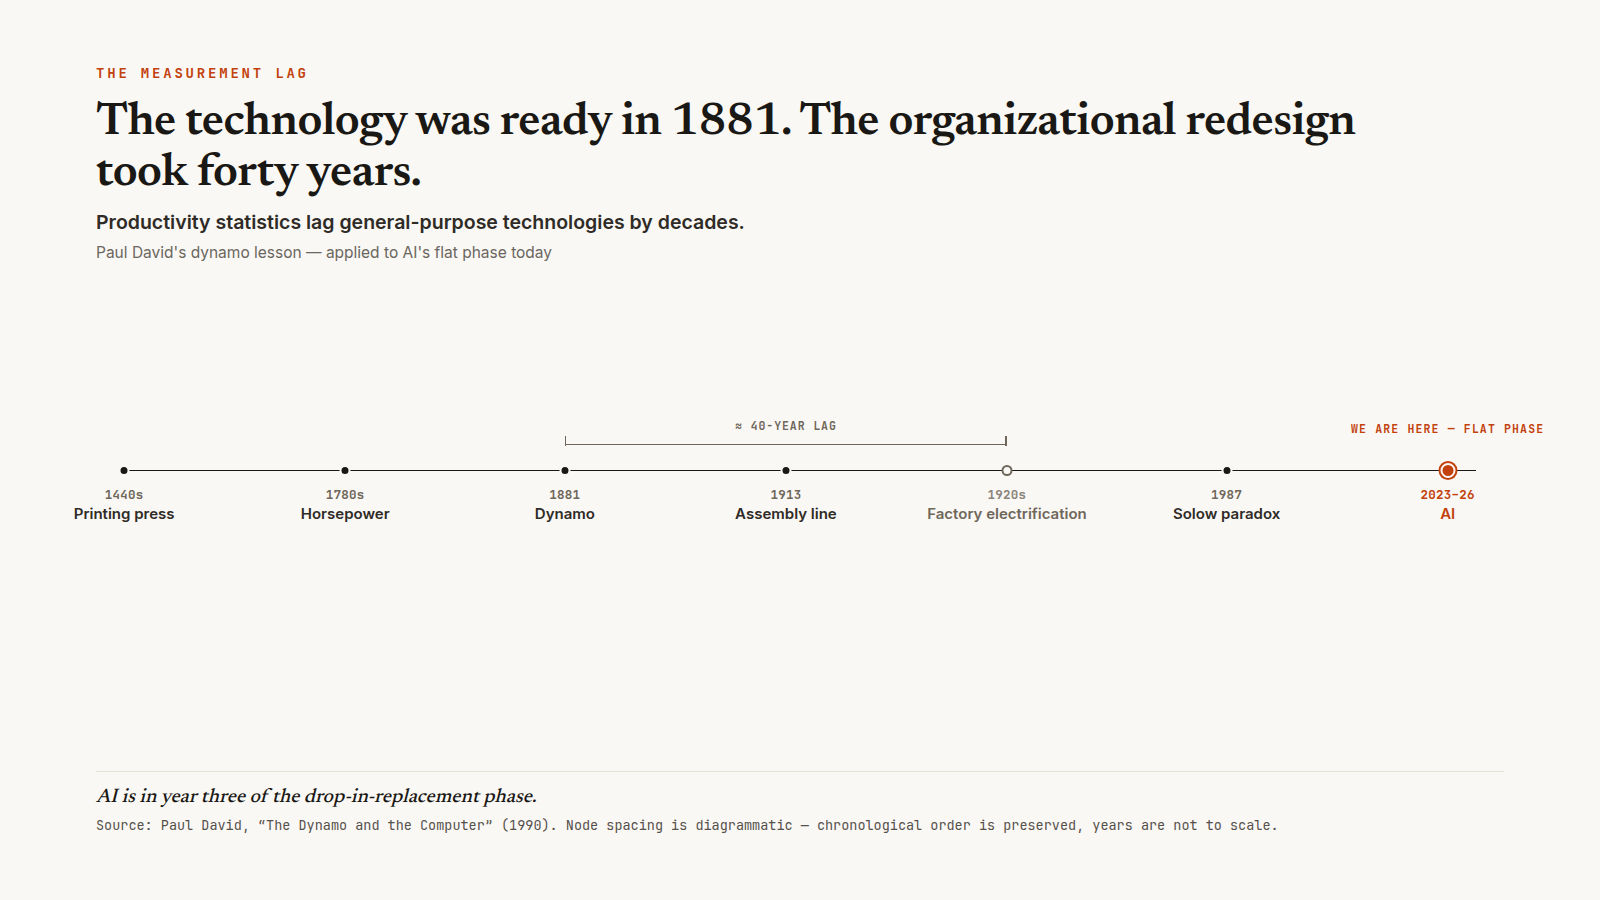 The technology was ready in 1881. The organizational redesign took forty years. — Paul David, The Dynamo and the Computer (1990)
AI may follow part of that pattern. If teams use it only to produce the same work faster, old measures may show little or capture the wrong stage. Larger gains may depend on reorganizing the work, and the useful measures may change with it. The analogy does not tell us how long that will take.
Where the work moved
I see early signs of that redesign on my team. Faster code production has not removed the coordination work. It has pushed more decisions toward product managers and toward engineers who can resolve ambiguity with stakeholders. When stakeholder loops, alignment, and discovery do not speed up with code production, the queue moves.
That changes what “full stack” can mean in practice. Technical range still matters, but so does the ability to talk to a stakeholder, make a judgment call about what to build, and reach the person who can resolve an ambiguity instead of waiting for a ticket to travel through a queue.
Some of the remaining work depends on domain history: knowing that the team avoids synchronous calls to the fraud-detection service because of a latency incident 18 months ago, or that an awkward abstraction carries business meaning. AI can inspect the code, but a developer still has to decide whether a change is safe in this system. In a 2021 study of 18,400 code reviews, 73% of architectural comments were addressed; the finding shows the concrete role review judgment can play, not a general measure of developer productivity.
The queue moved; the work did not disappear.
The answer I would give senior executives
When I am asked the two questions from the top, this is the answer I give.
“If you are waiting for our velocity to prove the value of AI, it will not. Our estimates already assume we use it. What I can show you is narrower, and I would argue more useful. This team now attempts work we used to defer. Support investigations that used to require a senior developer can be handled by junior developers working with diagnostic agents. Data-export requests that used to cost a developer a day or two each no longer enter our queue at all. And the constraint moved: code production is the cheap part now, and our queue builds in review, product coordination, and stakeholder decisions. That is where the next investment goes.”
Those claims are narrower than “the team is 50% faster.” They answer what became possible, what work disappeared, and where the queue builds now. They are also claims I can defend with evidence from the work itself, and they do not invite anyone to make a staffing decision based on a number that does not exist.
FAQ
Does AI make developers faster?
It depends on the task, population, tool, and outcome being measured. METR’s randomized trial found 16 experienced open-source developers took 19% longer on 246 real repository tasks with early-2025 AI tools. Controlled vendor studies of specific greenfield tasks have reported large gains, including GitHub Copilot’s 55.8%. Neither result is a trustworthy general aggregate number for a development team.
What should happen to developer velocity after AI adoption?
If developers already account for AI when estimating work, velocity may stay roughly flat. A task that used to be estimated as a three may become a one, because the team expects AI to handle part of it. That is an explanation of how the metric behaves, not a measured universal result.
Why did METR change its experiment?
The follow-up no longer resembled ordinary AI-assisted work. Some developers would not participate without AI, 30% to 50% withheld tasks they expected to be painful without it, and concurrent agents made time tracking unreliable. METR concluded that the task-level randomized design had become “a bad proxy for the real productivity impact” and moved to other designs, including surveys with weaker causal power.
Is AI making code quality worse?
Several observational datasets report worsening signals. GitClear found refactoring down 70% and code duplication up 81% across 623 million changes. Faros reported bugs per developer up 54% and production incidents per PR tripling under high AI adoption. These results do not prove AI caused every change, but they show why code volume alone cannot stand in for delivered value.
What should engineering leaders report instead of one productivity percentage?
Scoped operational changes with evidence: work the team can now attempt, recurring work that left the queue, and the location of the new constraint. On my team, the clearest examples are support investigations handled with diagnostic agents and data-export requests that no longer require a development story.
References
-
METR, “Measuring the Impact of Early-2025 AI on Experienced Open-Source Developer Productivity” (2025).
-
METR, “We are Changing our Developer Productivity Experiment Design” (February 2026).
-
METR, “Measuring the Self-Reported Impact of Early-2026 AI on Technical Worker Productivity” (May 2026).
-
Google DORA, “State of AI-assisted Software Development 2025”.
-
Demirer, Musolff, and Yang, “Writing Code vs. Shipping Code”, NBER Working Paper 35275 (2026).
-
GitClear, “The Maintainability Gap: AI Code Quality in 2026”.
-
Faros AI, AI engineering research, including AI Engineering Report 2026: Acceleration Whiplash.
-
Gartner, “Autonomous Business and AI Layoffs” (May 2026).
-
Brynjolfsson, Chandar, and Chen, “Canaries in the Coal Mine?” (Stanford Digital Economy Lab, 2025).
-
Paul David, The Dynamo and the Computer (1990).
-
Paixao et al., The Impact of Code Review on Architectural Changes (IEEE TSE, 2021).